المدة الزمنية 7:31:35
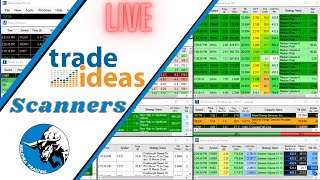
LIVE: Trade Ideas Scanners For Day Trading - Breakouts, Unusual Volume, Reversals, etc 08/25/23
تم نشره في 2023/08/26
📈Join the Market Master Group to watch live with no delay: https://masterthemarket.teachable.com/p/market-master-group-join Other features of the group: - Team chat - Day trade & swing trade alerts - Detailed trade plans - Powerful tools - One on one support 📚Enroll in the Master the Market Bundle for premium education: https://masterthemarket.teachable.com/p/master-the-market-bundle 👉Create your own Trade Ideas scanners: https://go.trade-ideas.com/SHgG (Use coupon code “MASTERTHEMARKET” to save 15%) ✅Scanner Guide: - Pre-Market Gap Up: List of stocks with the largest gap up in the pre-market trading session! Potential uses can be for a gap and go or to short-sell a weak gap up. - Pre-Market Gap Down: List of stocks with the largest gap down in the pre-market session! Potential uses can be to short-sell into the downward momentum or to catch a bounce trade. - Top % Gainers: List of stocks with the largest % gain from their previous day’s closing price. - Top % Losers: List of stocks with the largest % loss from their previous day’s closing price. - Halt / Resume: Displays when a stock is halted, often for volatility, and when the trading is resumed. - Opening Range Breakouts: One of my favorite strategies for a gap and go! This scanner displays when a stock is breaking above its opening range breakout level, either on the 5 minute, 10 minute, or 15 minute timeframe. - Unusual Volume: High relative volume and volume spikes can be indicative of a big move in the stock market or a potential reversal point! This scanner displays stocks meeting that criteria and canoe very useful when paired with data from a different scanner. - Intraday Pullbacks: Displays stocks that have made an upward move and are currently retracing, or pulling back. This scan often provides great dip buying opportunities! - Crossing VWAP: Displays when a stock is either crossing above or below their VWAP, which can signal a shift in the stock’s overall direction and offer a variety of trade opportunities! - New High / Breakout: Displays when a stock is breaking out and reaching a new high for the day! Stocks hitting this scanner often have major intraday momentum and can be great from quick scalps to new highs. - 5 Min Overbought / Oversold: When a stock has an RSI of 70 or higher, it is considered overbought and due for a pullback. When a stock has an RSI of 30 or lower, it is considered oversold and due for a bounce. This scanner find and displays those stocks! - Bullish Patterns: Displays bullish patterns for day trading including hammer candlesticks, bullish engulfing candlesticks, inside bar breakouts, inverted head and shoulders, double bottoms, etc! Please give this video a like and subscribe to the channel if you enjoyed the content! Your support is appreciated! DISCLAIMER: These videos are not to be used as investment advice. Any security mentioned or displayed is to be used strictly for educational / entertainment purposes, not as a buy/sell recommendation! 📩Email: 10percenttrader@gmail.com #TradeIdeas #LiveScanners #DayTrading
الفئة
عرض المزيد


تعليقات - 0
مقاطع الفيديو ذات الصلة على LIVE: Trade Ideas Scanners For Day Trading - Breakouts, Unusual Volume, Reversals, etc 08/25/23: